Click here to download this week's dataset as a CSV
Click here to download this week's dataset as a Hyper Extract
Data Storytelling and Dataviz Approach
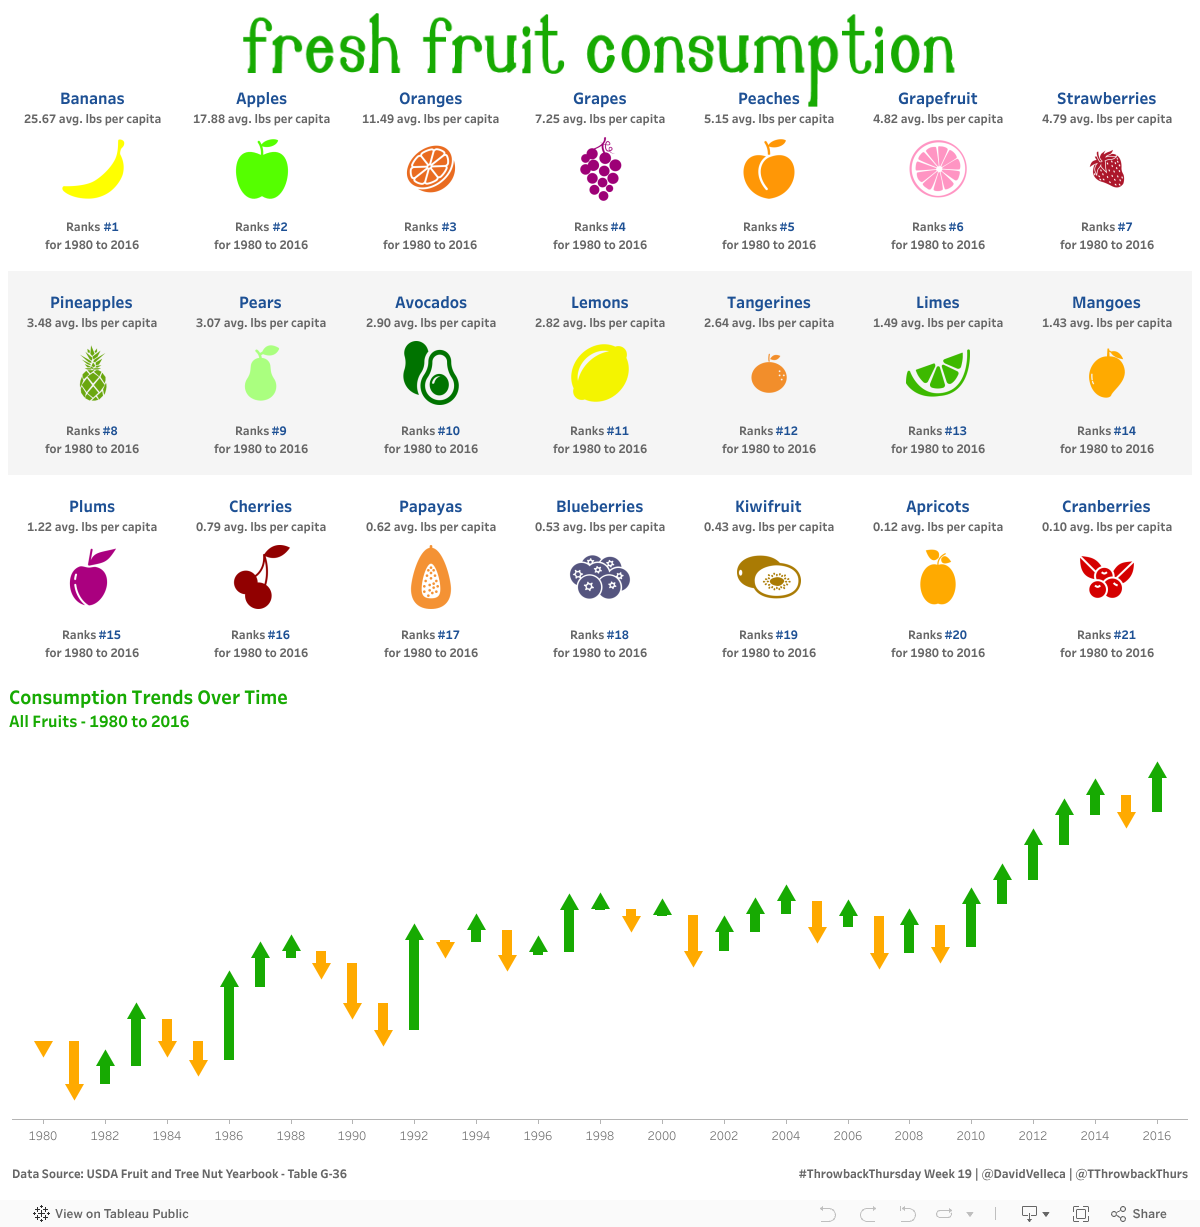
For this week, I wanted to look at both the changes in fresh fruit consumption over time, as well as the ranking of each fruit by consumption. To accomplish the task of showing the rank of each fruit's consumption, I used small multiples with calculated fields for [Row] and [Column] being driven off of a RANK calculation. For the small multiples, I used a custom Shape palette, built from icons sourced from The Noun Project.
In addition to the shapes, I used several calculated fields to drive the text that is pertinent based on both the fruit, it's rank and the year selected by interacting with the bottom viz. Interacting with the bottom viz, by clicking on a year, will re-order the fruits in the top viz based on their rank for the selected year, and updating the stats on consumption appropriately.
The bottom viz is a waterfall chart that shows changes in fruit consumption by year. This is accomplished using a Gannt chart, with multiple calculated fields to make the size and color look correct. Additionally, to provide some clarity regarding the direction of the waterfall chart - which may be unfamiliar to some people - I used a dual axis chart with custom arrow shapes to indicate the direction of the waterfall. Additionally, the same calculated field that drives the shape is also responsible for the color.
I wanted the viz to be completely interactive, so clicking on a fruit in the top viz filters the bottom to show changes in consumption for the selected fruit, and clicking on a year in the bottom viz filters the small multiples above to show the rank of each fruit by the chosen year. Overall, a pretty straightforward viz.
If you'd like to see what you can come up with, publish your work to Tableau Public, and Twitter with the hashtag #ThrowbackThursday, tagging @TThrowbackThurs. We'd really love to see what you can come up with!
Data Source
The dataset this week was sourced from the USDA Fruit and Tree Nut Yearbook. Please be sure to cite the source on your viz.